In the landscape of the American economy, “household income” is the standard metric for prosperity. However, a growing segment of the population lives in households that report zero regular income. According to the latest Census Bureau American Community Survey (ACS) data, roughly one in four U.S. households (approximately 33.1 million) are classified as having “no income.”
This classification does not necessarily mean these individuals have zero resources; rather, it indicates a lack of regular cash receipts from wages, business income, unemployment benefits, or retirement payments. Understanding where these households are concentrated reveals a stark contrast between population density and economic vulnerability.
Defining “No Income” in the Modern Economy
Before diving into the rankings, it is essential to define what the U.S. Census Bureau considers a “no-income” household. This category typically includes:
- The Unemployed: Individuals who have exhausted benefits or are not currently receiving them.
- The Elderly: Retirees who may live off savings or non-cash assets rather than a monthly pension or Social Security check.
- Students: Independent households composed of students living on loans or parental support.
- The Disabled: Those waiting for SSI/SSDI approval or who do not meet specific cash-payment criteria.
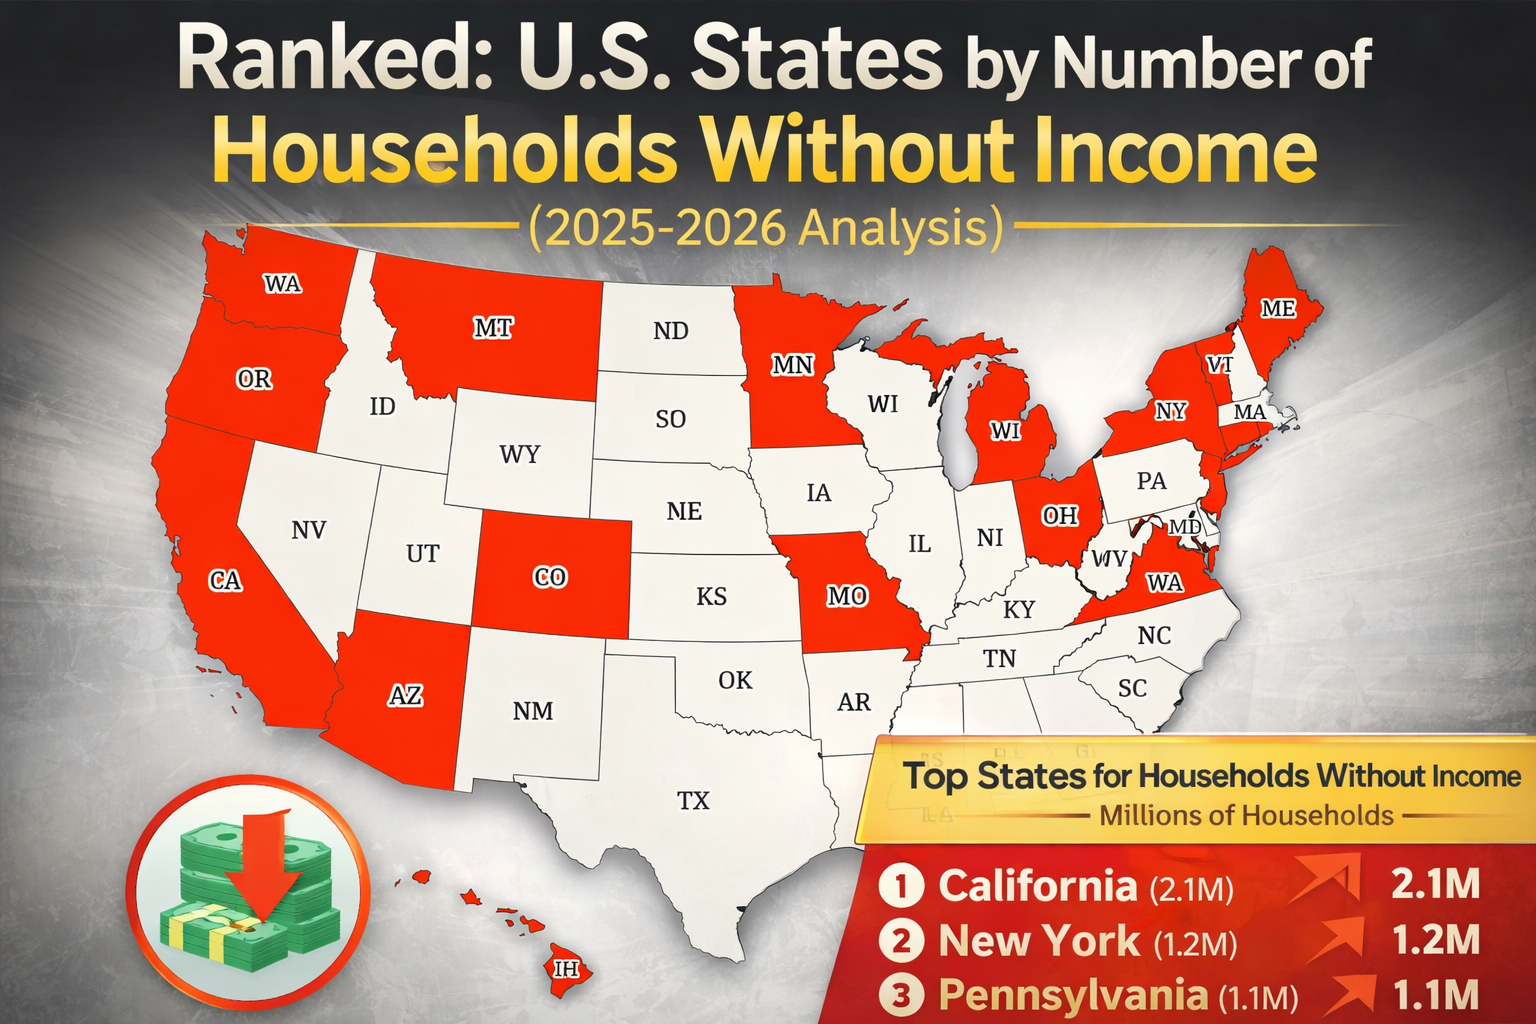
Top 10 States by Total Number of No-Income Households
When looking at absolute numbers, the most populous states naturally lead the list. These figures highlight where the sheer scale of the “zero-income” crisis is most visible.
| Rank | State | Total No-Income Households | Share of State Total |
| 1 | California | 3.1 Million | 23% |
| 2 | Florida | 2.64 Million | 29% |
| 3 | Texas | 2.36 Million | 21% |
| 4 | New York | 2.01 Million | 26% |
| 5 | Pennsylvania | 1.44 Million | 27% |
| 6 | Ohio | 1.28 Million | 27% |
| 7 | Illinois | 1.15 Million | 24% |
| 8 | Georgia | 1.05 Million | 26% |
| 9 | Michigan | 1.02 Million | 28% |
| 10 | North Carolina | 0.98 Million | 24% |
1. California: The Paradox of Prosperity
California holds the highest number of no-income households in the nation at 3.1 million. Despite being the world’s fifth-largest economy if it were a country, the state’s high cost of living and massive population create a unique vacuum. Interestingly, while California has the most households in this category, its percentage (23%) is actually below the national average of 25%. This suggests that the issue is primarily a byproduct of its massive scale rather than a systemic economic failure compared to other states.
2. Florida: The Retirement Factor
Florida ranks second with 2.64 million households. Unlike California, Florida’s percentage is significantly higher at 29%. Experts point to the state’s demographic makeup—a high concentration of retirees—as a primary driver. Many Florida residents may live on assets or savings that are not counted as “regular income” in census surveys, alongside a service-heavy economy that often leaves seasonal workers with periods of zero income.
3. Texas: A Growing Divide
Texas follows closely with 2.36 million households. Despite a booming tech and energy sector, the “Texas Miracle” has not reached everyone. Texas has a relatively low share (21%) compared to the national average, but the sheer volume of people moving to the state means the absolute number of those struggling remains a massive challenge for local social services.
The “Concentration” View: States with the Highest Percentage
While the total numbers are highest in big states, the rate of no-income households tells a different story about regional poverty.
West Virginia: The National Leader in Rate
West Virginia has the highest share of no-income households in America at 34%. This means more than one out of every three households in the state lacks regular cash income. The decline of the coal industry and a lack of diversified economic opportunities have left the Appalachian region particularly vulnerable.
The Deep South and New Mexico
States like Mississippi (30%), New Mexico (31%), and Arkansas (30%) also see high concentrations. In these regions, systemic poverty, lack of educational attainment, and limited access to high-growth industries create a cycle where households frequently cycle in and out of the “no-income” status.
States with the Lowest Prevalence
On the opposite end of the spectrum, some states have managed to keep the number of no-income households remarkably low.
- Utah: Holds the lowest rate in the country at just 17%. Utah’s strong family support networks and diversified economy are often cited as reasons for its economic resilience.
- District of Columbia: Despite having pockets of extreme poverty, DC reports a low 19% share, largely due to a high concentration of salaried federal and contract employees.
- Alaska and Colorado: Both sit at 21%, benefiting from high-wage industries (energy and tech, respectively) and relatively smaller, more concentrated populations.
Factors Driving the 2026 Statistics
As of early 2026, several macroeconomic factors have influenced these rankings:
- The Aging Population: With a record number of Baby Boomers entering retirement, “income” as defined by the Census is shifting. If a household lives solely on a 401(k) withdrawal, it might not always be captured in the same way as a traditional salary.
- The Gini Index and Inequality: Income inequality remains at historic highs. In states like New York and Connecticut, the gap between the top 1% and the bottom 99% is the widest, contributing to a “hollowed out” middle class.
- The “ALICE” Population: Many households are “Asset Limited, Income Constrained, Employed.” These are families that earn above the Federal Poverty Level but cannot afford basic necessities. When a job loss occurs, they immediately fall into the “zero-income” category because they lack a financial safety net.
Conclusion
The ranking of U.S. states by no-income households reveals a tale of two Americas. In one, the high numbers in California and Texas reflect the challenges of managing massive, growing populations. In the other, the high percentages in West Virginia and Mississippi reflect deep-seated, systemic economic struggles.
As we move further into 2026, these statistics serve as a vital pulse check for policymakers. Addressing the “zero-income” gap requires more than just job creation; it requires a focus on educational attainment, affordable housing, and a modernizing of how we support an aging and changing workforce.


Leave a Reply